
plot() plots Coord1D, Coord2D, Polygon2D, Ellipse2D, and
Segment2D class objects.
points() draws Coord1D and Coord2D class objects to an existing plot.
lines() draws Coord2D, Ellipse2D, Point1D, Line2D, and Segment2D
class objects to an existing plot.
If the suggested ggplot2 and rgl packages
are available we also register ggplot2::autolayer() methods for Coord1D,
Coord2D, Ellipse2D, Line2D, Point1D, Polygon2D, and Segment2D
class objects and rgl::plot3d() methods for Coord3D and Plane3D class
objects.
Usage
# S3 method for class 'Coord1D'
plot(x, ...)

# S3 method for class 'Coord1D'
points(x, ...)

# S3 method for class 'Point1D'
lines(x, ...)

# S3 method for class 'Coord2D'
plot(x, ..., asp = 1)

# S3 method for class 'Coord2D'
points(x, ...)

# S3 method for class 'Coord2D'
lines(x, ...)

# S3 method for class 'Polygon2D'
lines(x, ...)

# S3 method for class 'Ellipse2D'
lines(x, n = 60L, ...)

# S3 method for class 'Polygon2D'
plot(
  x,
  ...,
  col = NA,
  border = NULL,
  density = NULL,
  angle = 45,
  fillOddEven = FALSE,
  asp = 1
)

# S3 method for class 'Ellipse2D'
plot(
  x,
  n = 60L,
  ...,
  col = NA,
  border = NULL,
  density = NULL,
  angle = 45,
  fillOddEven = FALSE,
  asp = 1
)

# S3 method for class 'Line2D'
lines(x, ...)

# S3 method for class 'Segment2D'
plot(x, ..., asp = 1)

# S3 method for class 'Segment2D'
lines(x, ...)
Arguments
- x
A supported object to plot.
- ...
Passed to the underlying plot method.
- asp
the y/x aspect ratio.
- n
Number of vertices used to approximate each ellipse (default
60L).- col, border, density, angle, fillOddEven
Passed to
graphics::polygon().
Examples
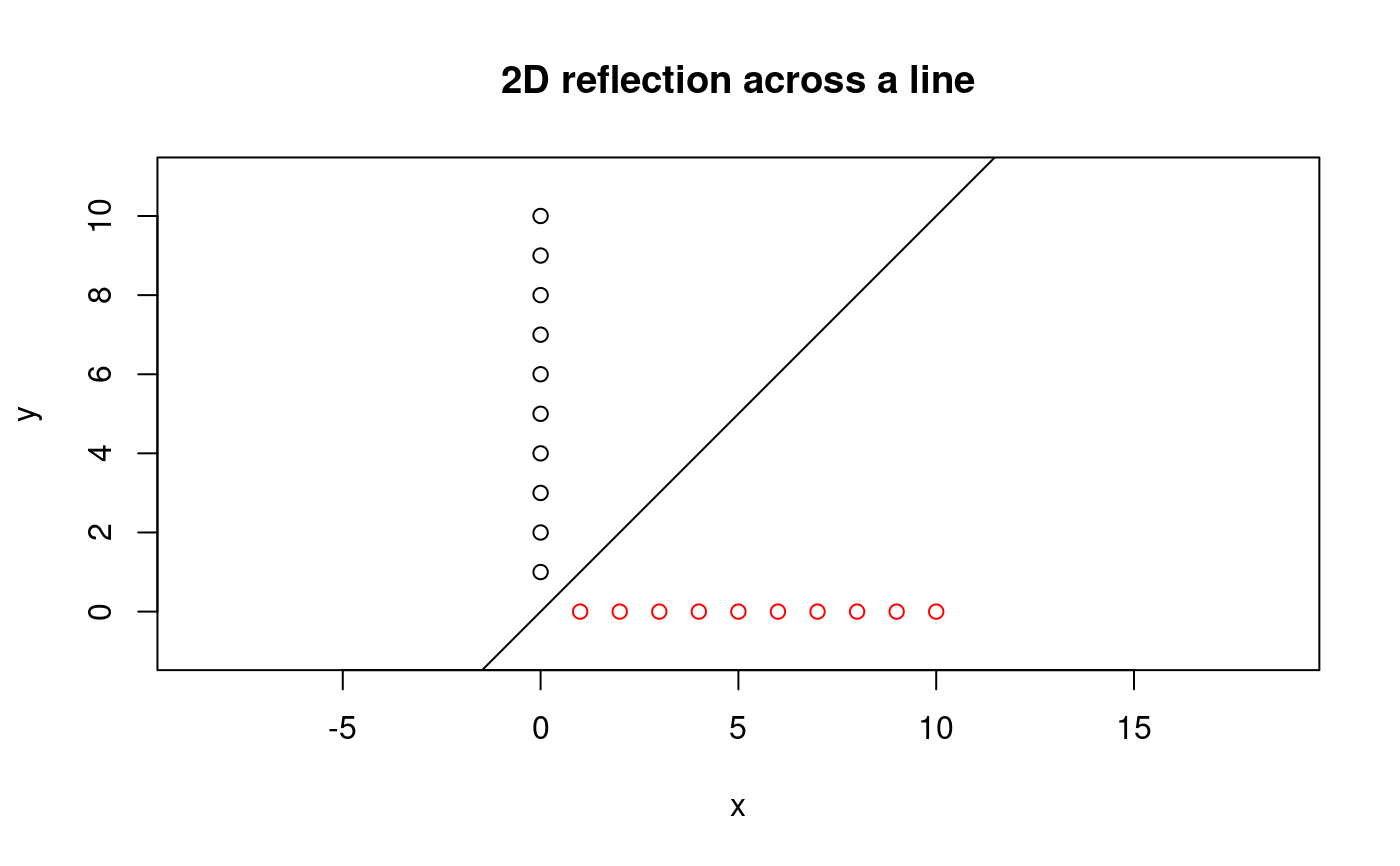
c1 <- as_coord2d(x = 0, y = 1:10)
l <- as_line2d(a = 1, b = -1, c = 0) # y = x
c2 <- c1$clone()$reflect(l)
plot(c1, xlim = c(-1, 11), ylim = c(-1, 11),
main = "2D reflection across a line")
lines(l)
points(c2, col = "red")
 c1 <- as_coord2d(x = 1:10, y = 1:10)
l <- as_line2d(a = -1, b = 0, c = 0) # x = 0
c2 <- c1$clone()$project(l)
if (require("ggplot2", quietly = TRUE,
include.only = c("ggplot", "autolayer", "labs"))) {
ggplot() +
autolayer(c1) +
autolayer(l) +
autolayer(c2, color = "red") +
labs(title = "2D projection onto a line")
}
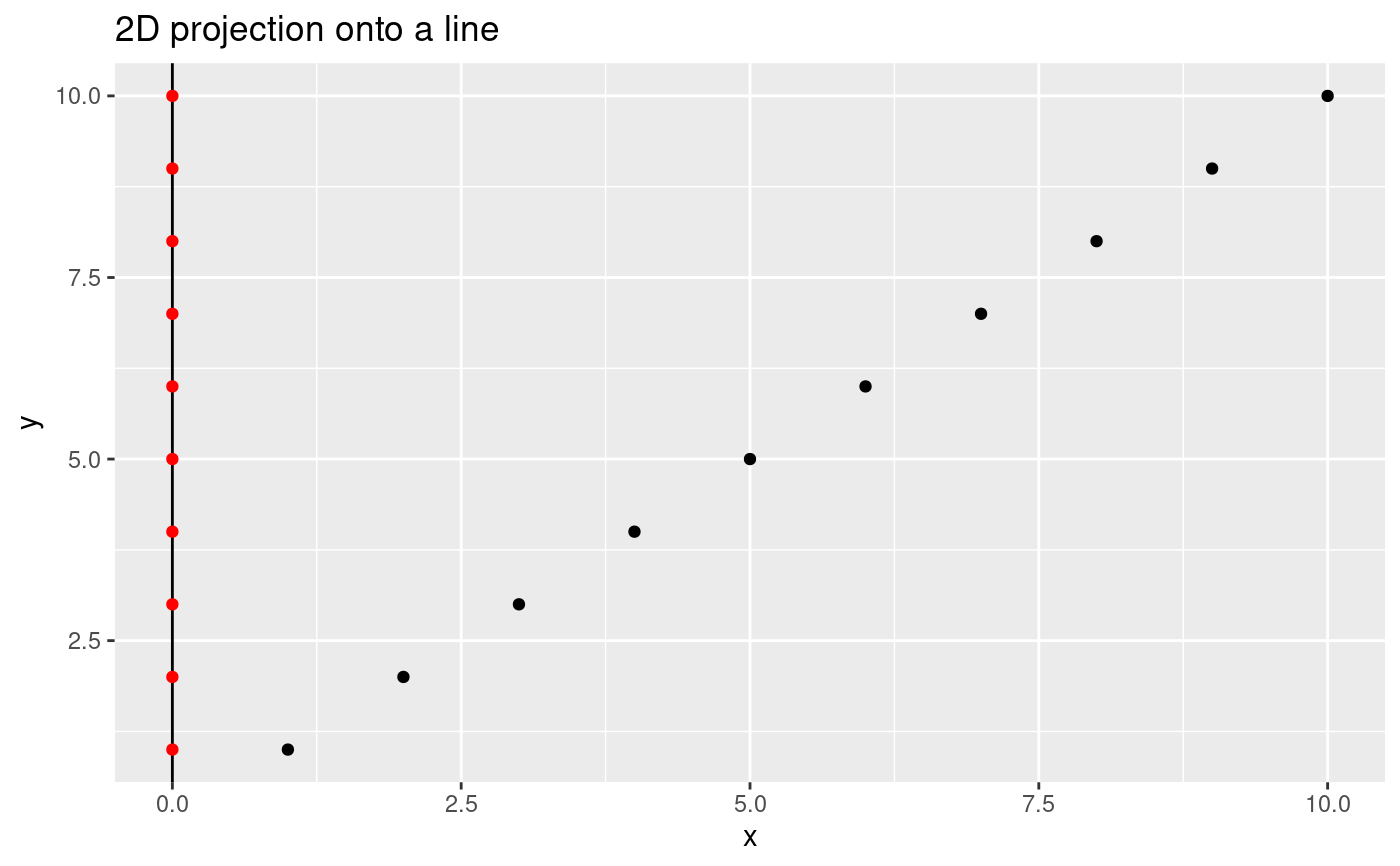
c1 <- as_coord2d(x = 1:10, y = 1:10)
l <- as_line2d(a = -1, b = 0, c = 0) # x = 0
c2 <- c1$clone()$project(l)
if (require("ggplot2", quietly = TRUE,
include.only = c("ggplot", "autolayer", "labs"))) {
ggplot() +
autolayer(c1) +
autolayer(l) +
autolayer(c2, color = "red") +
labs(title = "2D projection onto a line")
}
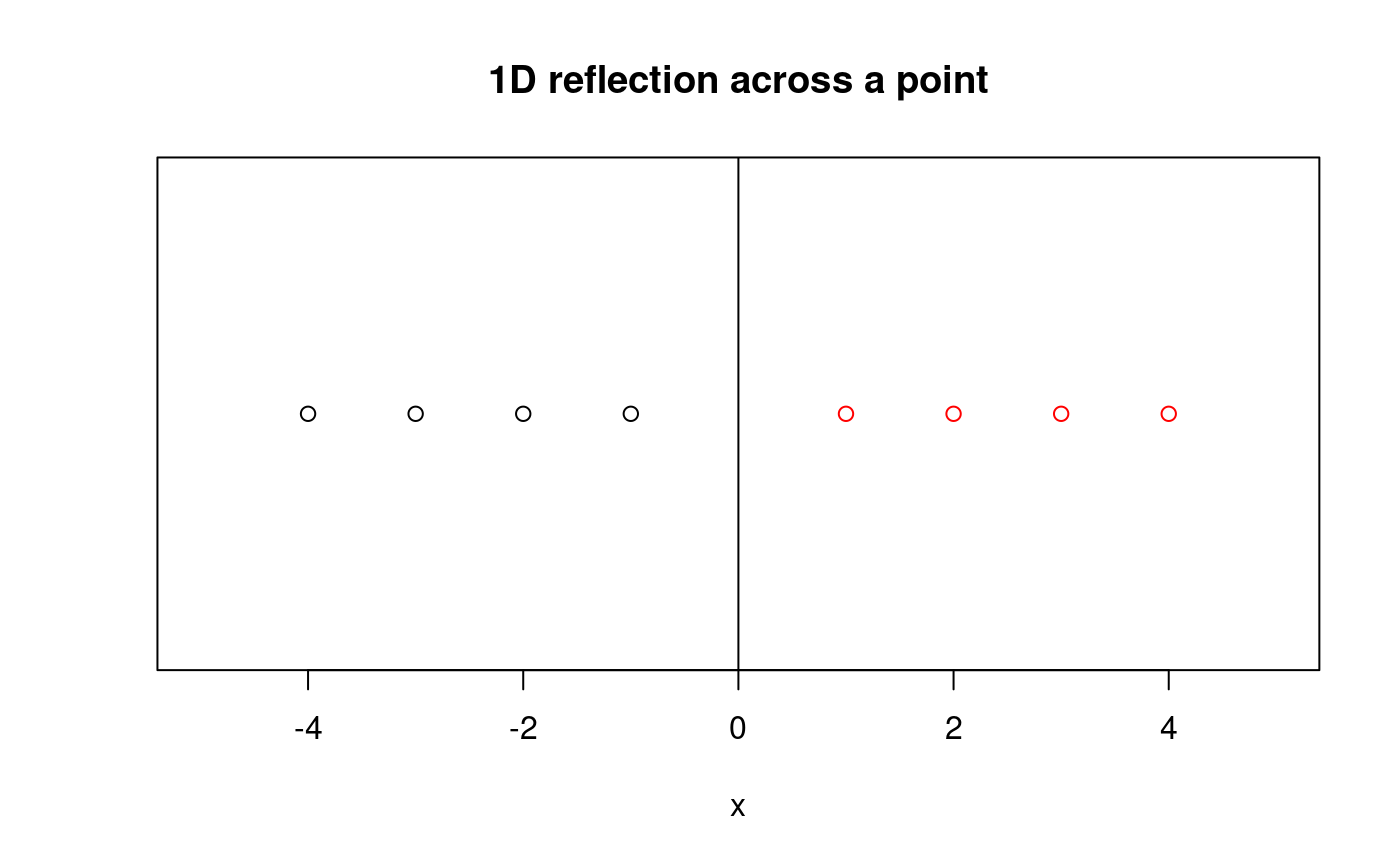
 c1 <- as_coord1d(x = seq.int(-4, -1))
pt <- as_point1d(a = 1, b = 0) # x = 0
c2 <- c1$clone()$reflect(pt)
plot(c1, xlim = c(-5, 5), main = "1D reflection across a point")
lines(pt)
points(c2, col = "red")
c1 <- as_coord1d(x = seq.int(-4, -1))
pt <- as_point1d(a = 1, b = 0) # x = 0
c2 <- c1$clone()$reflect(pt)
plot(c1, xlim = c(-5, 5), main = "1D reflection across a point")
lines(pt)
points(c2, col = "red")
 # 3D reflection across a plane
c1 <- as_coord3d(x = 1:10, y = 1:10, z = 1:10)
pl <- as_plane3d(a = 0, b = 0, c = -1, d = 2) # z = 2
c2 <- c1$clone()$reflect(pl)
if (require("rgl", quietly = TRUE, include.only = "plot3d")) {
plot3d(c1, col = "blue", size = 8)
plot3d(pl, color = "grey", alpha = 0.6)
plot3d(c2, add = TRUE, col = "red", size = 8)
}
# 3D reflection across a plane
c1 <- as_coord3d(x = 1:10, y = 1:10, z = 1:10)
pl <- as_plane3d(a = 0, b = 0, c = -1, d = 2) # z = 2
c2 <- c1$clone()$reflect(pl)
if (require("rgl", quietly = TRUE, include.only = "plot3d")) {
plot3d(c1, col = "blue", size = 8)
plot3d(pl, color = "grey", alpha = 0.6)
plot3d(c2, add = TRUE, col = "red", size = 8)
}
3D plot