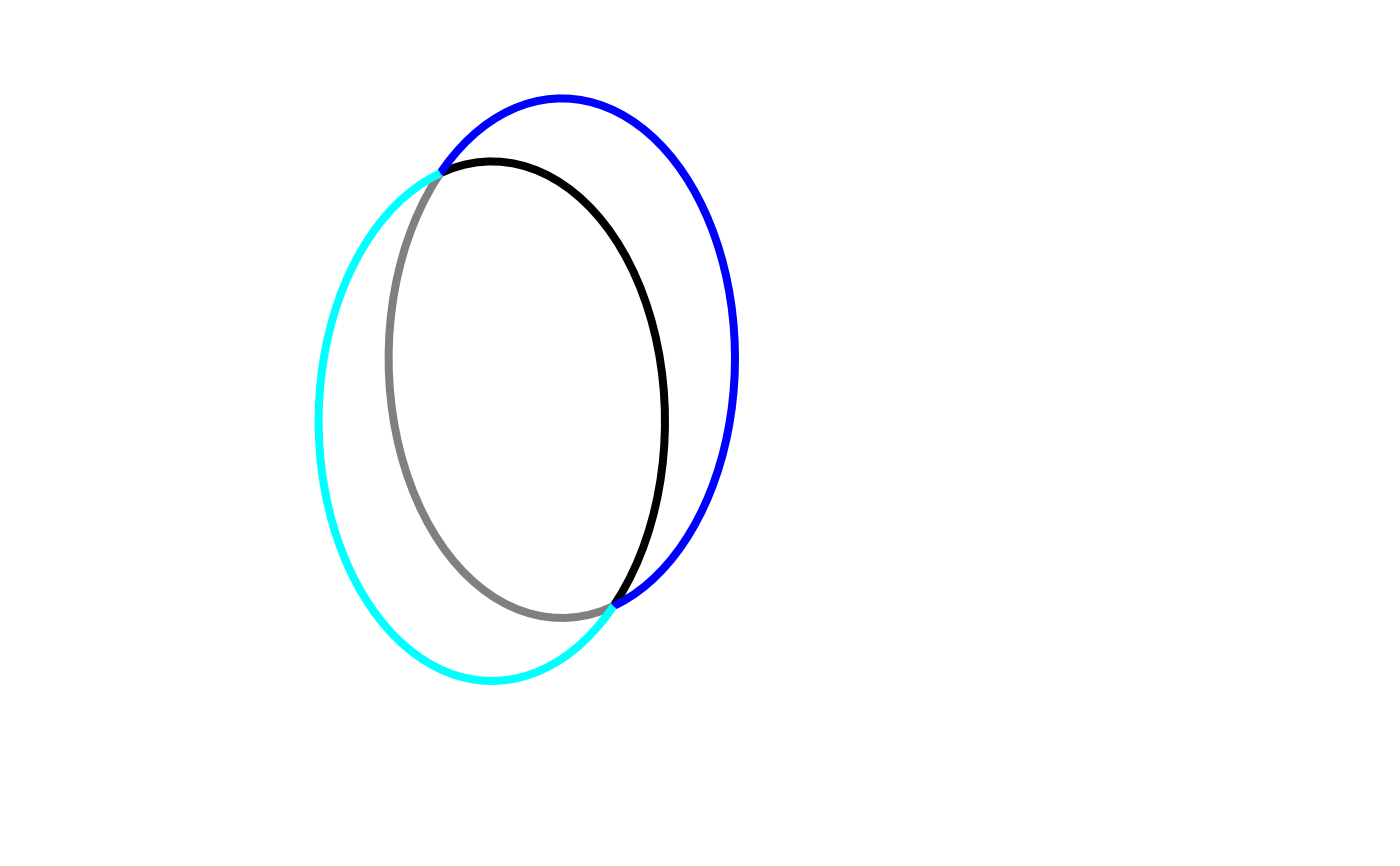
A() and aa() draw elliptical arc curve commands.
Usage
A(
  rx,
  ry = rx,
  x_axis_rotation = -a,
  large_arc_flag = big,
  sweep_flag = cw,
  x,
  y = NULL,
  ...,
  sep = getOption("dee.sep", ","),
  origin_at_bottom = getOption("dee.origin_at_bottom", FALSE),
  height = getOption("dee.height", NULL),
  digits = getOption("dee.digits", Inf),
  a = 0,
  cw = FALSE,
  big = FALSE
)

aa(
  rx,
  ry = rx,
  x_axis_rotation = 0,
  large_arc_flag = FALSE,
  sweep_flag = FALSE,
  x,
  y = NULL,
  ...,
  sep = getOption("dee.sep", ","),
  origin_at_bottom = getOption("dee.origin_at_bottom", FALSE),
  height = getOption("dee.height", NULL),
  digits = getOption("dee.digits", Inf)
)

AZ(...)

az(...)
Arguments
- rx, ry
Radius of ellipse.
- x_axis_rotation, a
Angle (in degrees) to rotate ellipse clockwise. Will be coerced by
affiner::degrees(). IfisTRUE(origin_at_bottom)then will be multiplied by-1in the output.ais an alternative that instead rotates the ellipse counter-clockwise.- large_arc_flag, big
If
TRUEthen the arc will be one of two larger arc sweeps else one of the two smaller arc sweeps.bigis an alias.- sweep_flag, cw
If
TRUEthen the arc will be one of the two possible arcs in the "clockwise" direction. else one of the two in a "counter-clockwise" direction. IfisTRUE(origin_at_bottom)then will be inverted in the output.cwis an alias.- x
If
yisNULLwill be coerced byaffiner::as_coord2d(). Else a numeric vector.- y
Either
NULLor a numeric vector.- ...
Passed to related function.
- sep
Either
","or" ".- origin_at_bottom, height
If
origin_at_bottomisTRUEtheny(and anyy1andy2) coordinates is transformed byheight - yfor absolute coordinates and-yfor relative coordinates.- digits
xandy(and anyx1,y1,x2,y2) will be transformed byround(, digits). AnInf(default) means no rounding.
Value
A dee() object.
Examples
M(1, 1) + A(rx = 1, x = 2, y = 2) + Z()
#> <dee[1]>
#> M 1,1 A 1,1 0,0,0 2,2 Z
M(1, 1) + aa(rx = 1, x = 1, y = 1) + zz()
#> <dee[1]>
#> M 1,1 a 1,1 0,0,0 1,1 z
d_small_ccw <- M(40, 70) + A(rx = 20, ry = 30, x = 20, y = 20)
d_small_cw <- M(40, 70) + A(rx = 20, ry = 30, x = 20, y = 20, cw = TRUE)
d_big_ccw <- M(40, 70) + A(rx = 20, ry = 30, x = 20, y = 20, big = TRUE)
d_big_cw <- M(40, 70) + A(rx = 20, ry = 30, x = 20, y = 20, big = TRUE, cw = TRUE)
if (requireNamespace("omsvg", quietly = TRUE) &&
    requireNamespace("nanosvgr", quietly = TRUE)) {
  plot(c(d_small_ccw, d_small_cw, d_big_ccw, d_big_cw),
    height = 100, width = 100,
    stroke = c("black", "grey", "blue", "cyan"),
    fill = "none", stroke_width = 4)
}