Introduction
Several dedicated ggpattern vignettes cover many gridpattern patterns:
-
patterns-stripes:
stripe,crosshatch,wave, andweave -
patterns-points:
circle,pch,regular_polygon, androse -
patterns-tilings:
polygon_tilingandmagick -
patterns-image:
imageandplaceholder -
patterns-noise:
ambient,plasma, andgradient
The following gridpattern patterns are not yet featured in such a dedicated ggpattern vignette:
Data
Standard data used in the example plots below.
df <- data.frame(trt = c("a", "b", "c"), outcome = c(2.3, 1.9, 3.2))Pattern ‘aRtsy’
The aRtsy pattern generates generative art fills powered by the {aRtsy} package. This pattern requires aRtsy to be installed. Use gridpattern::names_aRtsy() to list all supported types.
For more information see help("grid.pattern_aRtsy", package = "gridpattern").
set.seed(42)
ggplot(df, aes(trt, outcome)) +
  geom_col_pattern(
    aes(pattern_type = trt),
    pattern = "aRtsy",
    pattern_fill = "steelblue",
    colour = "black"
  ) +
  scale_pattern_type_manual(values = c("strokes", "maze", "flow")) +
  theme_bw() +
  labs(title = "pattern = 'aRtsy'")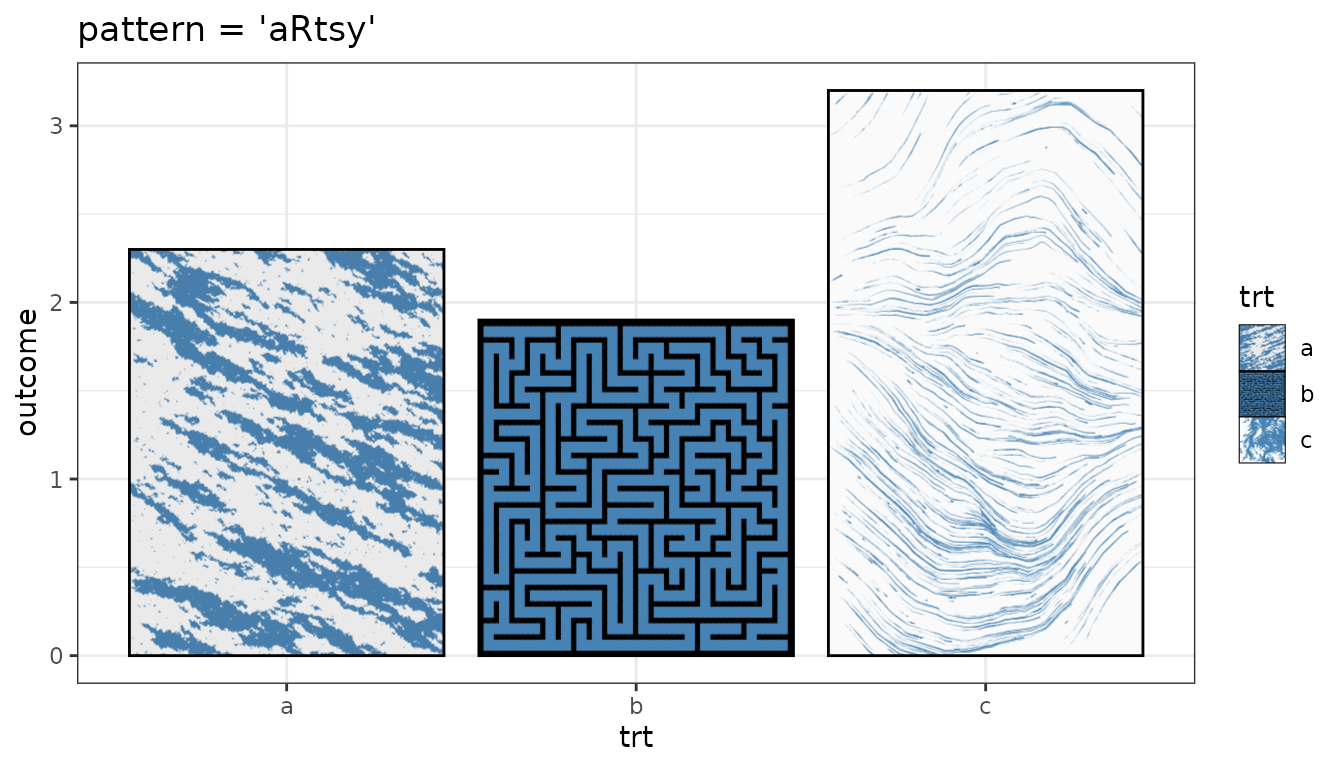
Pattern ‘fill’
The fill pattern simply fills the area with a solid colour (any pattern_fill aesthetic will cover the fill aesthetic).
For more information see help("grid.pattern_fill", package = "gridpattern").
ggplot(df, aes(trt, outcome)) +
  geom_col_pattern(
    aes(pattern_fill = trt),
    pattern = "fill",
    colour = "black"
  ) +
  theme_bw() +
  labs(title = "pattern = 'fill'")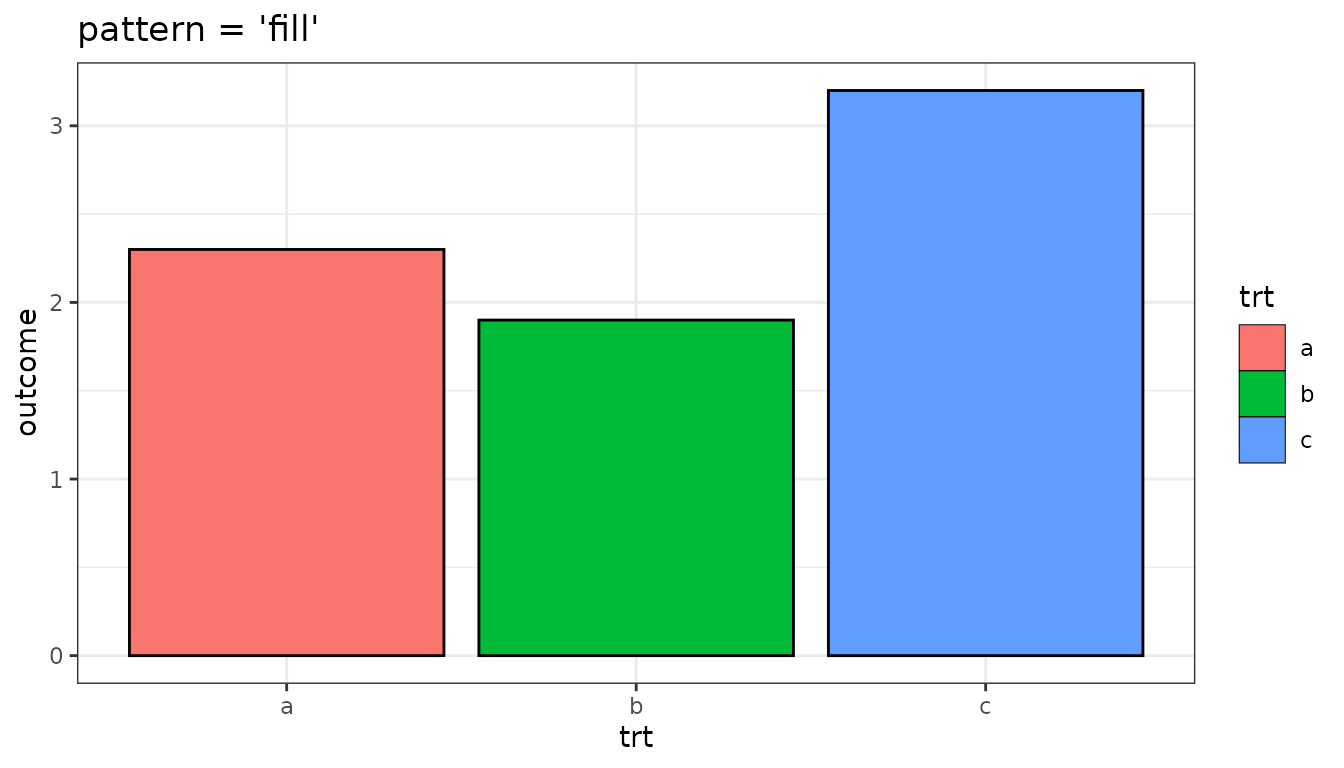
Pattern ‘hatch’
The hatch pattern draws heraldic colour hatching. Each hatching type corresponds to a traditional tincture (e.g. "gules" for red, "azure" for blue). Use gridpattern::names_hatch() to list all supported types.
For more information see help("grid.pattern_hatch", package = "gridpattern") and vignette("hatching", package = "gridpattern").
ggplot(df, aes(trt, outcome)) +
  geom_col_pattern(
    aes(pattern_color = trt, pattern_type = trt),
    fill = "white",
    pattern = "hatch",
    pattern_subtype = "combinatorial",
    colour = "black"
  ) +
  scale_pattern_type_manual(values = c("gules", "azure", "sable")) +
  scale_pattern_color_manual(values = c("darkred", "darkblue", "black")) +
  theme_bw() +
  labs(title = "pattern = 'hatch'")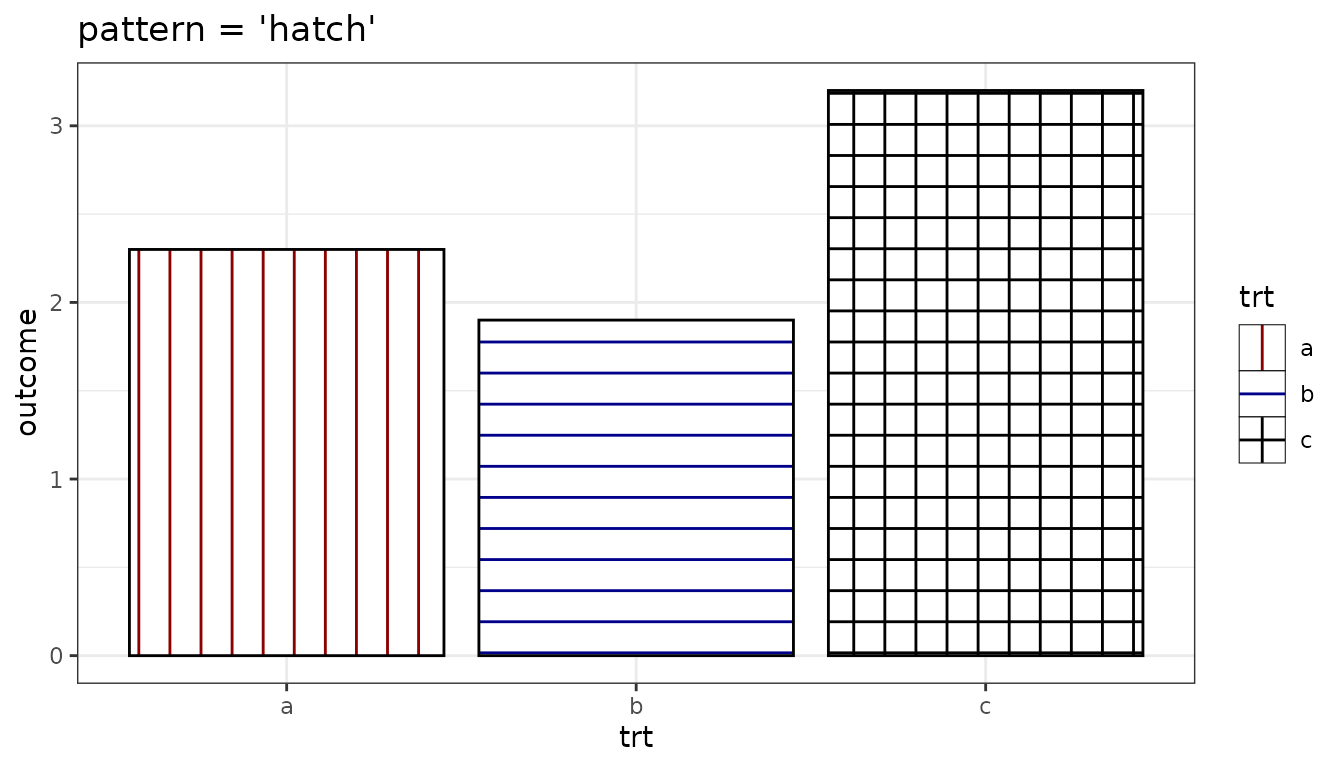
Pattern ‘line’
The line pattern draws stroked lines using the device’s native line renderer. Unlike stripe (which fills bands with solid colour), line honours all of R’s built-in linetype values — including "dotdash", "twodash", and custom hex-string line types.
For more information see help("grid.pattern_line", package = "gridpattern").
ggplot(df, aes(trt, outcome)) +
  geom_col_pattern(
    aes(pattern_linetype = trt),
    pattern = "line",
    pattern_colour = "black",
    pattern_density = 0.5,
    colour = "black",
    fill = "white"
  ) +
  scale_pattern_linetype_manual(values = c("solid", "dotted", "twodash")) +
  theme_bw() +
  labs(title = "pattern = 'line'")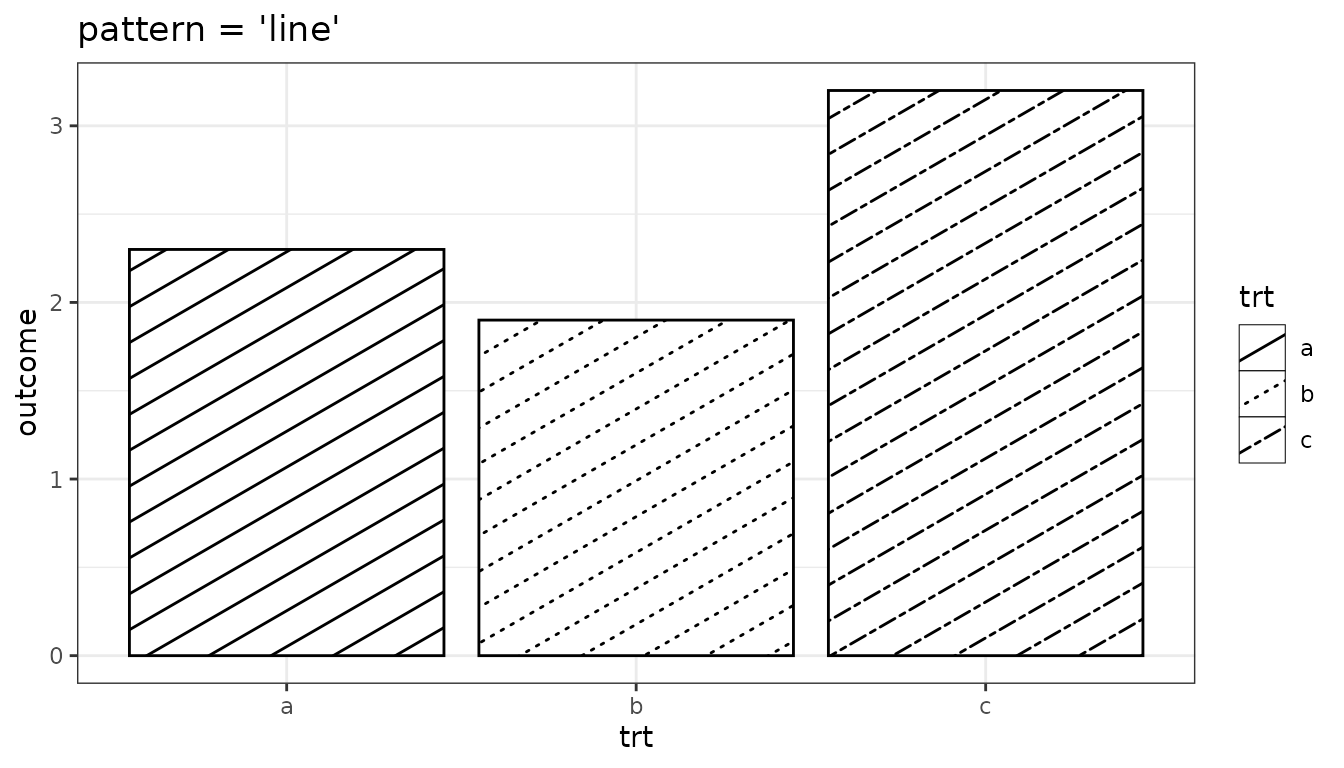
Pattern ‘none’
The none pattern renders no pattern overlay.
For more information see help("grid.pattern_none", package = "gridpattern").
ggplot(df, aes(trt, outcome)) +
  geom_col_pattern(
    pattern = "none",
    fill = "steelblue",
    colour = "black"
  ) +
  theme_bw() +
  labs(title = "pattern = 'none'")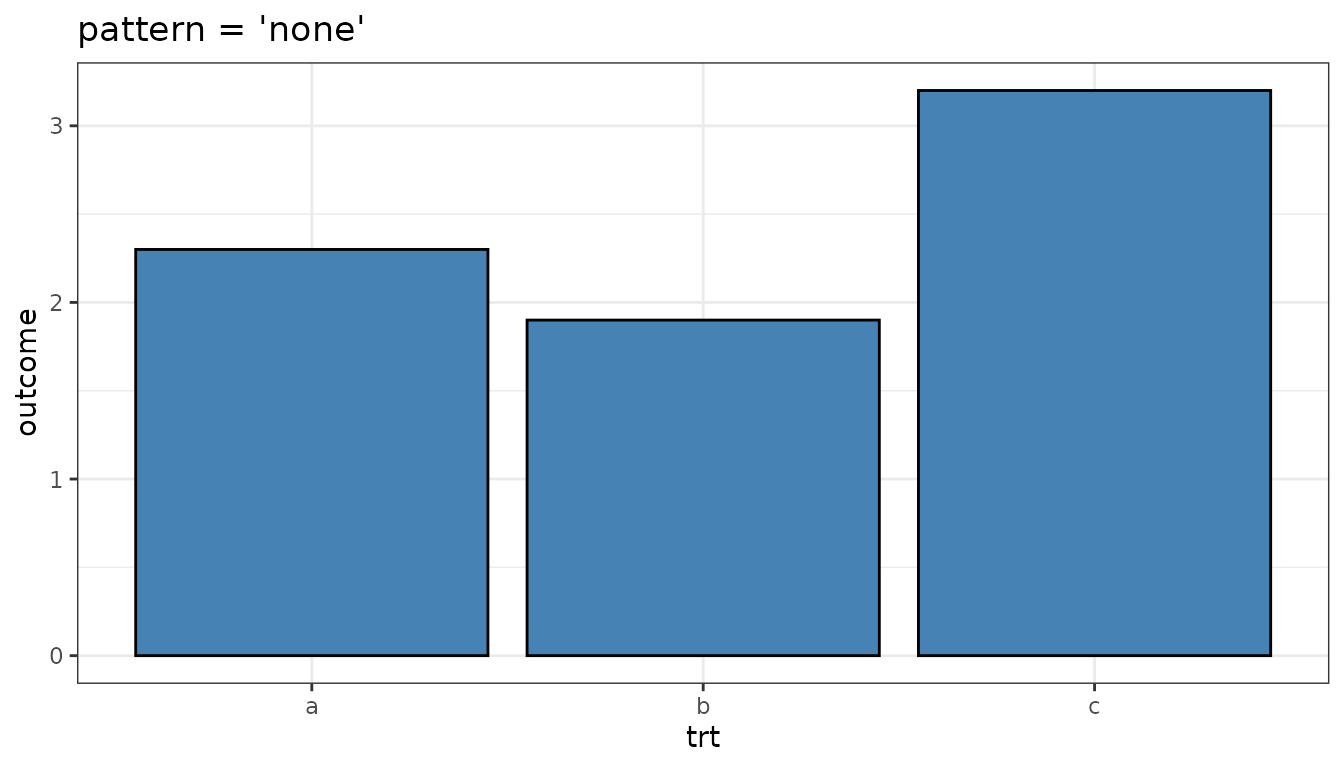
Pattern ‘text’
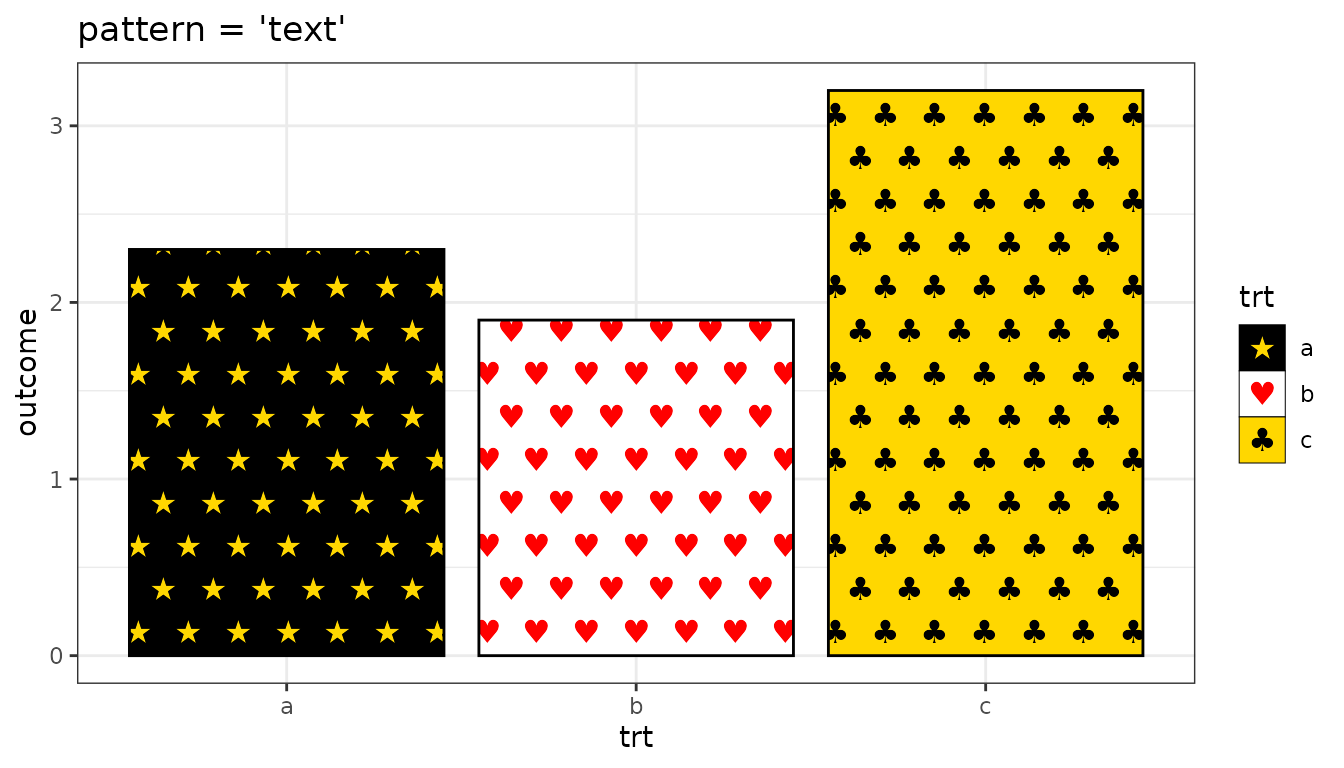
The text pattern tiles the area with repeated text characters or expressions.
The character is controlled by pattern_shape.
For more information see help("grid.pattern_text", package = "gridpattern").
ggplot(df, aes(trt, outcome)) +
  geom_col_pattern(
    aes(fill = trt, pattern_color = trt, pattern_shape = trt),
    pattern = "text",
    pattern_size = 12,
    pattern_spacing = 0.08,
    pattern_grid = "hex",
    pattern_angle = 0,
    colour = "black"
  ) +
  scale_fill_manual(values = c("black", "white", "gold")) +
  scale_pattern_color_manual(values = c("gold", "red", "black")) +
  scale_pattern_shape_manual(values = c("★", "♥", "♣")) +
  theme_bw() +
  labs(title = "pattern = 'text'")